Ice is slippery quarry. Always moving, never sleeping, it vanishes and reappears, grows and shrinks, advances and retreats. It builds up over periods of geological time and can crumble in the wink of a polar summer. Today, earth’s great ice sheets sprawl over Antarctica and Greenland, the vast, sliding bodies polished by the harshest conditions on the planet, layered with millennia of snowfall packed more than two miles thick in spots: a colossal architecture moving constantly under its own weight, sloping toward the sea.
Robin Bell ’89GSAS is watching. Bell, a geophysicist at Columbia’s Lamont-Doherty Earth Observatory and one of the world’s leading polar investigators, has been tracking ice for thirty years: inspecting it, measuring it, drilling it, flying over it, spying under it, peering through its layers, sleeping on it, skiing on it. She has coordinated ten expeditions to Antarctica and Greenland, which between them hold more than 99 percent of the world’s frozen fresh water.
That ice is transforming before her eyes.
“There are three lines of evidence that the ice sheets are changing,” Bell says. “One: in some places they are flowing twice as fast as they were twenty years ago — a mile a year in the last decade, two miles a year now. Two: their elevation has dropped. Three: they are losing mass, which we can tell from satellite measurements.”
Melting ice, together with the expansion of oceans due to warming (warm water is less dense), is raising sea levels faster than scientists had expected. And while the earth has a natural climate cycle of warming and cooling that repeats every hundred thousand or so years, the big difference this time is the human factor. Since the Industrial Revolution, we have pumped more than five hundred billion tons of heat-trapping carbon dioxide into the atmosphere. Scientific consensus holds this activity to be the main driver of the warming — and melting — that has drowned islands in the Pacific, caused unusual weather events across the globe, and placed coastal areas, home to hundreds of millions of people and trillions of dollars of property, under increasing threat of devastation.
So Bell has been on scientific stakeout. She and her colleagues in Lamont’s Polar Geophysics Group, including Marco Tedesco and Jonathan Kingslake, are working to decipher the nature of the planet’s ice — its makeup, its mechanics, its behavior. They are building a character profile of their subject, drilling down for clues, extracting information. The goal is to use this data to improve computer models and projections for sea-level rise, for the benefit of the engineers, city planners, insurers, ecologists, business owners, government agencies, and residents whose destinies are linked, by the ocean, to the least-known topography on earth.
How high will the water go? In 2013, the United Nations Intergovernmental Panel on Climate Change issued a worst-case estimate for sea-level rise of three feet by 2100. In 2015, NASA said it expected a minimum of three feet. And in 2017, the National Oceanic and Atmospheric Administration stated that end-of-the-century sea-level rise could reach as high as 8.2 feet, enough to engulf waterfront cities around the world.
But Bell, acknowledging that our understanding of the ice is still limited, demurs on the specifics of future sea-level rise. “My belief is that we don’t know yet,” she says. “That’s because we don’t know what’s going on underneath the ice. You might think the land underneath is flat, but it’s not: it’s a very rich environment, with mountains and lakes, and places that can funnel in warm water.
“We need to know what happens when warm water comes into contact with the ice sheet, as well as what happens as warm air creates more surface meltwater.” The only way to figure it out, Bell says, is to get “up close and personal” with the subject. This case can’t be solved from afar.
“In the last hundred years, sea level has gone up eleven inches. In the next hundred years, will it go up to your waist or over your head?
“That,” Bell says, “is what we’re trying to pin down.”
The Rosetta Code
Growing up in New Hampshire in the 1960s, Bell liked to watch the small animals in her backyard. She was captivated by their habits. For her, nature overflowed with wonders. Her favorite TV show was The Undersea World of Jacques Cousteau. As a kid she wanted to be a marine biologist.
Then, between high school and college, she took some classes and learned about physics and plate tectonics. She thought: here is the key to how the planet works.
The creatures faded from the garden of her imagination. She saw rock now. Water. Motion. Reaction. The white chalk of formulas scratched on green slate.
She gravitated to geophysics, focusing on the oceans, until her curiosity swept her toward the ice, to Antarctica, home to almost 90 percent of the earth’s frozen water — “a place on our planet yet to be explored and understood,” Bell says.
Bell made her first Antarctic expedition as a geophysics doctoral student in the late 1980s. Much has changed since then. For one thing, the planet has gotten warmer: sixteen of the seventeen hottest years on record (record-keeping began in 1880) have occurred since 2000. That’s an especially salient fact when you’re chasing ice.
For the last two years, Bell’s team has explored the Ross ice shelf, the world’s largest piece of floating ice. Ice shelves are platforms of glacial runoff that extend from the land-based ice sheet onto the water, cantilever-like, often accreting to the size of small countries. (The Ross is about the size of France.) They act as doorstops for the glaciers, restraining them from the sea. The collapse of an ice shelf doesn’t directly contribute to sea-level rise (just as melting ice cubes don’t raise the level of your drink); rather, their disintegration allows the glaciers to flow unchecked. And the Ross is the biggest doorstop of them all. In 2000, it produced, or calved, a 4,200-square-mile iceberg, the largest ever recorded.
Wedged between East and West Antarctica and fed by glaciers from both parts of the continent, the Ross juts up at the sea’s edge in sheer white cliffs 160 feet high. It was discovered by James Clark Ross, a British polar explorer, in 1841, and has since served as a base of operations for landmark expeditions to the continental interior. Now it’s the focus of a multi-institutional mapping project called Rosetta, after the stone slab that led to the decoding of Egyptian hieroglyphics. The effort, headed by Bell, examines the interactions between the ice, the earth, and the ocean, and how the shape of the bedrock beneath the ice influences ocean currents.
“The Ross ice shelf is particularly sensitive,” Bell says, “because its bottom is exposed to ocean. Warm water gets underneath the ice. We’re figuring out the pathways that the water takes to get in.” The Ross, then, is vulnerable from above — in January 2016, unusually warm winds caused extensive surface melting — and below.
That worries Bell.
“We think the shelf is under stress,” she says.
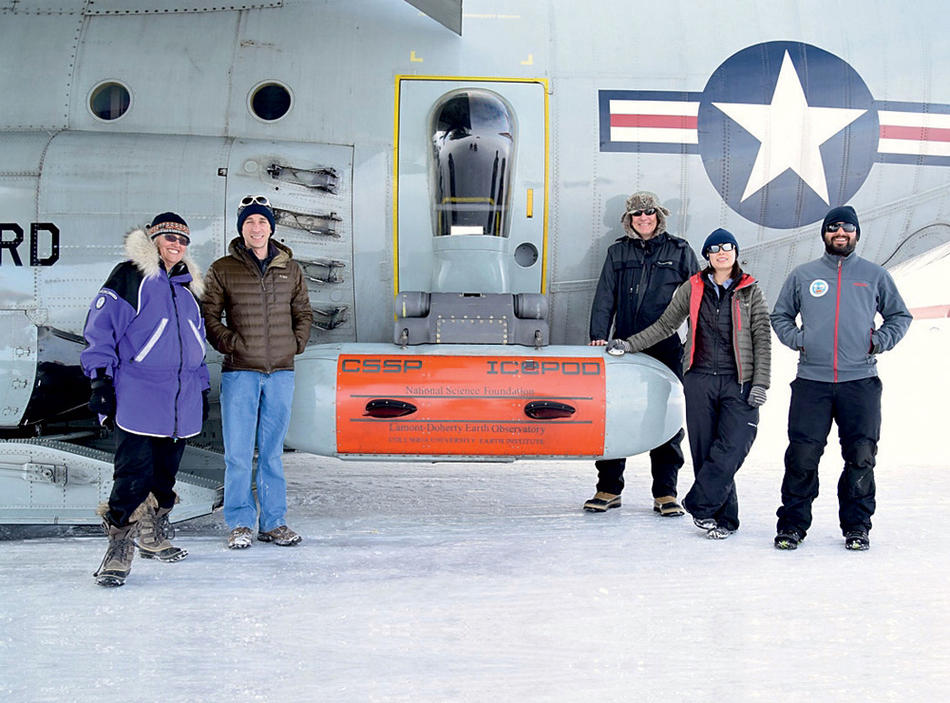
To investigate, Bell and her team deploy a custom-made device called IcePod — an eight-and-a-half-foot-long instrument-filled fiberglass capsule that attaches to the LC-130 transport planes that take Lamont researchers to the ice sheets. Designed and built with grant money from the National Science Foundation (NSF), IcePod is rigged with conventional and infrared cameras adapted for ice use by Lamont oceanographer Chris Zappa ’92SEAS (the infrared cameras can detect unseen cracks, or crevasses, by measuring tiny variances in ground temperature); shallow- and deep-ice radar built by Nick Frearson, IcePod’s lead engineer; a scanning laser to create 3D images of the ice surface; and a magnetometer to measure the earth’s magnetic field.
The radar images capture jagged cross sections of the Ross ice in shades of MRI gray, revealing what Bell calls “the beautiful layers inside.”
Decoding the mysteries of the Ross ice shelf — to see where it’s melting — is no fly-by-night affair. Last year’s trip was hampered by bad weather, and the team could not finish the study. “While we can tell where it’s melting in the front of the ice shelf, we still don’t know what’s going on in the back,” Bell says. She hopes that the NSF will support another trip in order to complete this benchmark data set.
“Where we’re working now, the last time they collected data was in the 1970s. That data is plugged into every ice-sheet model predicting what’s going to happen in the future. To still be using data from almost fifty years ago is just stunning, so we’re hoping to improve that.” Bell smiles, acknowledging the scope of the enterprise. “We’re trying,” she says, “to understand the basic topography of the earth.”
The Case of the Blue Dots
Seven years ago, Jonathan Kingslake, now a Lamont glaciologist, was working on his PhD at the University of Sheffield, in the UK. In his thesis he used mathematical models to examine how water moves underneath the ice sheets.
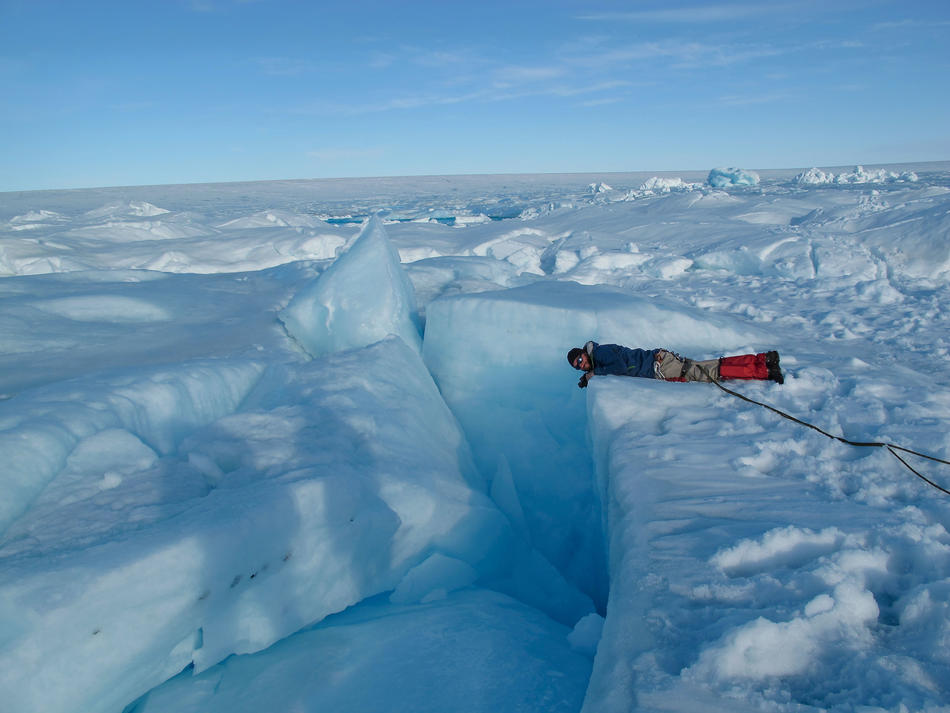
In the course of this research, Kingslake got to thinking — “just for fun,” he says — about surface water. He went on Google Earth, zoomed in on Greenland, and noticed something in the field of white: blue dots, speckling the rim of the ice.
He saw them in Antarctica, too: Windex-blue flecks of liquid water. Scientists know that if meltwater collects around the edge of the ice sheets and on the ice shelves, it can spell trouble, as water can seep into crevasses, forcing the ice apart, weakening the entire edifice. In 2002, satellite images showed that the Larsen B ice shelf on the Antarctic Peninsula, before its famously rapid and spectacular collapse, was stippled with blue dots. (This summer, the Larsen C ice shelf made news when it calved a Delaware-size iceberg.)
Kingslake wondered about the rest of Antarctica. No one had ever surveyed the 5.4-million-square-mile, ice-covered continent for surface water. Kingslake thought he might look into it someday.
In 2016, Kingslake came to Columbia as an assistant professor in the Department of Earth and Environmental Sciences. He hadn’t forgotten those blue dots. At Lamont he promptly led the first-ever systematic study of surface hydrology on the Antarctic ice sheet. Using images taken from military aircraft since 1947, and from satellites since 1973, Kingslake, with Lamont colleagues Bell and Indrani Das, as well as Jeremy Ely of the University of Sheffield geography department, revealed a world of unsuspected complexity. Far from a white blanket dappled with in situ pools of water, they found surfaces veined and braided with networks of waterways carrying meltwater across the ice sheet: continent-wide seasonal drainage systems of some seven hundred streams, rivers, ponds, and waterfalls.
Kingslake knew they’d found something important. “Amazingly, people weren’t really aware that there’s surface water being moved across long distances on the ice sheet,” he says. “These systems are very impressive, very large” — one pond was fifty miles long — “and much more widespread than we would have thought.”
This past April, Kingslake and his colleagues published their findings in Nature. They hypothesized that these drainage networks could deliver water to areas of ice shelves vulnerable to collapse — thus accelerating ice-mass loss in Antarctica.
The Adventure of the Melting Island
Greenland is the biggest island on the map, three times the size of Texas and more than three-quarters covered by ice. This ice sheet — the second largest on earth, flung over the Arctic landmass like a white bear rug — is pulling a monumental disappearing act: little by little, year by year, a little faster now, slowly giving ground.
As the glaciers retreat, Marco Tedesco pursues. Tedesco, a Lamont polar scientist, wants to know how much mass Greenland is losing, and by what processes — how much from ice flow into the ocean, or the calving of icebergs, or — the primary culprit now — surface meltwater.
Though Greenland holds just 10 percent of the world’s ice, increasing rates of ice loss make it the fastest-growing contributor to sea-level rise. Last year, it accounted for a quarter of the average global rise of slightly more than one-tenth of an inch. (Sea level is unevenly distributed; some areas see more rise than others.) Tedesco believes that Greenland has been caught in a feedback loop, which is accelerating the melt: warm temperatures melt sea ice (formed by the freezing of the ocean) and land ice (such as Greenland), exposing more seawater and darker ice layers (from trapped impurities like soot and dust, as well as algae and bacteria). These darker surfaces, in turn, absorb more solar radiation, which generates more warming, which melts more ice.
The Greenland ice sheet holds enough frozen water to raise sea levels by twenty-two feet. But just a tiny fraction of that rise can cause problems. “If you have storms hitting low-lying cities,” says Tedesco — cities like New York — “two or three inches of sea-level rise makes a huge difference.”
The summers of 2012 and 2015 were exceptional melt seasons in Greenland, and Tedesco was there both years. He calls 2012 “the Goliath” melting year, because it broke records for surface melting and total mass loss, just when sea ice was also shrinking to a record summer low. The conditions in 2015 were different, “though still alarming,” Tedesco says. In a paper published last year in Nature Communications, he noted the odd kinks that summer in the polar jet stream, the meandering river of atmospheric winds that loops around the northern latitudes, separating warm air from cold. In July 2015, the jet stream reached farther north than scientists had ever seen for that time of year, allowing a billow of warm air to intrude on northwest Greenland.
But why was the jet stream doing this — “going nuts,” as Tedesco says? One theory that Tedesco is investigating suggests that the decreasing temperature differential between the mid-latitudes (the earth’s temperate zones) and the Arctic can slow the jet stream, causing wild arcs, which carry warm, moist, mid-latitudinal air called “atmospheric rivers.” Tedesco wants to know how the melting events are connected to this transport of moisture, which has energy and heat.
“If we can make that link,” he says, “we can better understand the potential increase of surface melting — and link what happens in Greenland to the rest of the warming world.”
To get data, of course, you have to be in the field, up close and personal. “The fieldwork helps us understand the processes,” says Tedesco. “If we don’t understand them, we can’t put them into our model, and so we cannot do projections.”
This spring, Lamont scientists performed more fieldwork when Jonathan Kingslake went to the Great North. Kingslake’s six-week trip began in Schenectady, New York, at the New York Air National Guard base, which provides aerial support for government-funded polar expeditions. There, Kingslake and twenty others — researchers, support staff, and crew — boarded a ski-equipped LC-130 loaded with gear and tents for the six-hour flight to Greenland.
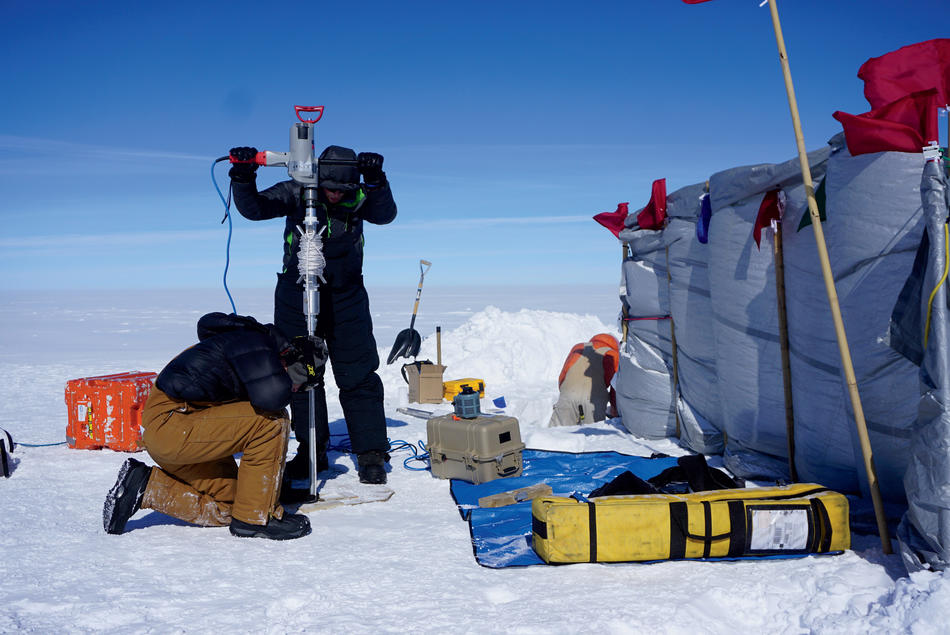
Kingslake spent four weeks in the field (the average temperature was in the single digits, with a low of -36°F), taking radar measurements and drilling for ice-core samples.
“When you use radar to look through the ice, you’re sending out a pulse and listening for the echo back,” Kingslake explains. “You get an echo from the bottom of the ice. This tells you the depth of the ice. If you want to predict what the ice sheet will do in the future, you need to know where the ground is — it’s totally fundamental.
“But we can also use radar to look at complex structures within the ice that help us understand many important processes.”
The ice cores, cylinders of condensed ice that show the bands of past seasons, are another way to read the ice sheet. Kingslake was looking for “ice lenses” — layers of ice that are formed by melted spring snow that refreezes.
“Meltwater that refreezes in the snow can create hard layers that are impermeable to water,” Kingslake says. “They impede the water’s flow, causing it to run horizontally. We always assumed it was fine if there’s melting at higher elevations, since there’s this huge sponge — the snow — to soak up the water.
“But if there’s a layer of ice just under the surface, the water simply runs off the ice sheet. Then the whole system changes.”
The Mystery of the Buried Mountains
Robin Bell was born in 1958 — or, as she likes to say, during the International Geophysical Year (IGY). The IGY, from July 1957 to December 1958, was a global scientific project devoted to the earth sciences — inquiries into the physical processes of land, ocean, and atmosphere, involving sixty-seven countries and providing a brief thaw in the Cold War.
For Bell, one of the more fascinating IGY discoveries occurred in Antarctica, where a Soviet expedition set foot atop the Antarctic ice sheet, ten thousand feet above sea level. To measure the thickness of the ice, the Soviets set off seismic charges and recorded the echoes, and took gravity readings. Since rock and ice produce different signals, they could detect where the ice had thinned — and where rock had risen. They soon realized that they had found, buried under the ice, an improbable, arresting formation.
The emerging picture shook the geophysical world. Encased in a two-mile-deep cover of ice stood an immense mountain range, more than seven hundred miles wide, with peaks of some nine thousand feet — as tall as the Alps. The explorers named the mountains after Grigory Gamburtsev, a Soviet seismologist.
Fifty years after the IGY, Bell jointly helped revive its long-defunct forebear, the International Polar Year (the first was in 1882–83; this was the fourth). Bell’s team from seven nations set out to study an area of Antarctica the size of California — including the Gamburtsev Mountains. Understanding how the mountains formed would give the scientists important data for ice-sheet and climate models, and help them scout the best places to drill for cores. These invisible peaks were the ice sheet’s birthplace, the point from which the ice grew and spread. The ice’s oldest climate record could be here.
Bell and her partners flew laps over the white fields of East Antarctica in two Twin Otter airplanes outfitted with deep-ice radar, magnetometers, and gravity meters to penetrate the secrets of the ice-entombed “ghost mountains.” It was in the course of these investigations that Bell and her team made their own startling discoveries.
Radar indicated that there was liquid water in every valley, running under the ice. The researchers expected that the water, warmed by the earth’s heat, would thaw the bottom of the valley ice, which was already close to melting temperature. (The top of the ice is around -50°F.) But the water did something unexpected.
“What’s beautiful,” Bell says, “is that we saw that water is being driven uphill.”
It was one of nature’s freak occurrences: due to the position and pressure of the ice, the water was being squeezed backward and upward. Even more astonishingly, this gravity-defying water, forced up the mountainsides to colder zones, was freezing back onto the bottom of the ice sheet, in accretions hundreds of feet thick. That meant that part of the ice sheet was growing faster from below than from above.
“Jaw-dropping” was how Bell described the discovery. Her colleagues gasped when they saw the data. “It’s like learning about a new piece of plumbing in your house,” Bell says. “Learning a new way that water can move around.” And while no one knew at the time that these processes could be important — “the Gamburtsevs are really in the middle of nowhere, far from anywhere that the ice sheet is changing,” Bell says — the same phenomenon has since been detected in Greenland.
Bell is encouraged by these findings — not because ice can form in surprising places, but because we’ve added to our understanding. “We are learning better how our planet is changing and how it will change in the future,” she says. “Our new knowledge provides us hope.”
The Big Drain
The Nansen ice shelf, a 695-square-mile nugget abutting the Southern, or Antarctic, Ocean, is a floating curiosity: despite evidence of widespread surface water, the Nansen is apparently stable. Why?
In April, Bell, with a team that included Lamont scientists Kingslake, Tedesco, Das, Kirsty Tinto, Zappa, Winnie Chu, and Alexandra Boghosian ’17GSAS, published a companion paper to the Kingslake-led study on the possible dangers of meltwater transport. Both papers appeared in the same issue of Nature.
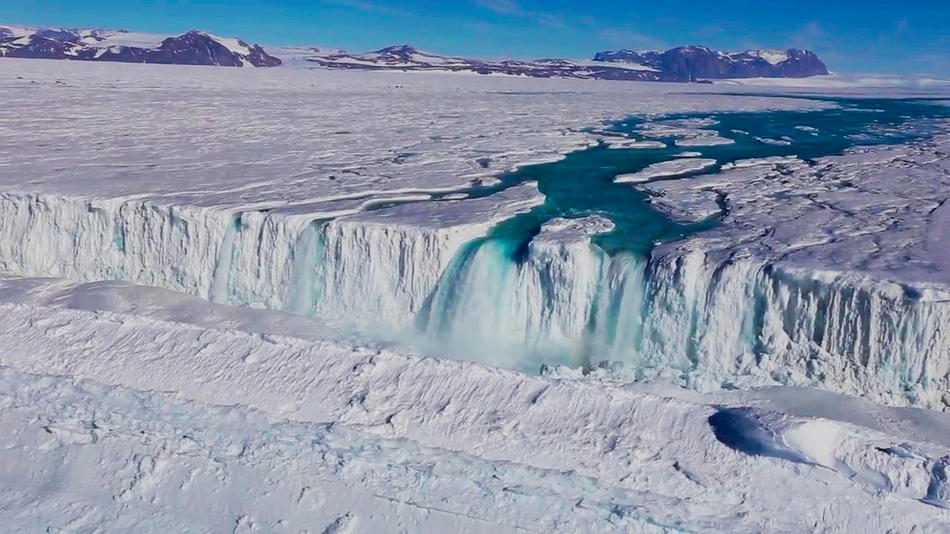
The Bell-led inquiry revealed another facet of the secret life of ice. Using satellite and aerial photography, radar data, and archival journals and photographs from Britain’s Northern Party expedition of 1910–1913, the researchers found that the Nansen ice shelf possessed networks of streams, ponds, and rivers that converged, near the shelf’s edge, in a spectacular 425-foot-wide waterfall.
The waterfall, they discovered, was capable of draining the shelf’s annual surface melt in a week. This meant that surface rivers don’t just transport water to other areas of the ice, exacerbating melting; they can wash standing water off the ice, potentially preventing this destruction.
Found to be active for more than a century, the Nansen drainage system adds a twist to existing Antarctic ice-sheet models. The variations complicate the question of the overall impact of water on the ice sheet.
“Will these drainage systems move water into places that are more vulnerable, or will they remove water from those areas?” Kingslake says.
He answers his question with perfect scientific equanimity, in words that resound through the great and howling icescapes of the world:
“We don’t know yet.”
Ice Dreams
Robin Bell has a vision. She wants investigators to fly all the way around Antarctica so that they can figure out the thickness of the ice that extends into the ocean, and find the troughs in the sea-floor bottom that funnel warm water. “If we can understand how and where the warming ocean is reaching the edge of the ice sheet,” she says, “we can better predict how much sea level will go up in the future.”
Though the climate for NSF global-warming research has cooled, Bell, who this year became president-elect of the American Geophysical Union, puts stock in America’s traditional leadership role in polar science, to which her ten expeditions attest. “We’re lucky to have really good support as a nation for Antarctic science,” she says.
But even in the most favorable conditions, there are never any guarantees.
Each expedition is “an incredibly pressure-filled, unique opportunity,” Bell says. “It often involves going to a place where nobody’s been for decades — and if you screw up, nobody might get to go again.” She thinks of the astronauts who went to the moon, and how no one has gone back since 1972. It’s a similar feeling, going to the ends of the earth.
“You’re trying to keep everyone together and everyone safe, and trying to squeeze every last bit you can out of the expedition, because you don’t know if or when you’ll get back,” she says.
And all the while, the ice keeps moving, changing, slipping, and sliding; and the ice detectives, in the field and at their desks, continue their restless surveillance, knowing that the clues they find today will have a life beyond their own: another layer in the frozen record, to be studied by future scientists.
“When you collect data, you might not even know the right questions to ask of it,” Bell says. “It’s going to be a legacy.”